Steel, with its exceptional strength, versatility, and wide-ranging applications, is one of the most vital materials in modern engineering. Have you ever wondered how the properties of steel are influenced by its composition and heat treatment? Look no further than the Iron Carbon Phase Diagram, a powerful tool that holds the key to understanding the behavior of iron-carbon alloys.
Iron Carbon Phase Diagram
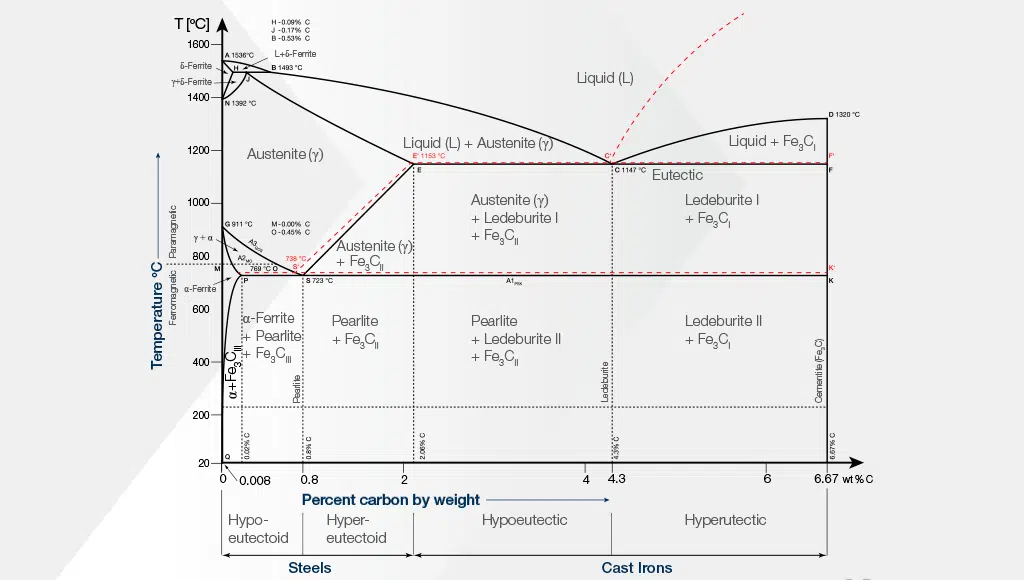
At its core, the Iron Carbon Phase Diagram is a graphical representation of the different phases that iron and carbon can form under specific temperature and carbon composition conditions. This diagram is a roadmap that guides metallurgists and materials scientists in predicting the microstructure and properties of steel.
Let us explore some of the key features and phases represented in the Iron Carbon Phase Diagram. At low carbon concentrations, pure iron exists in the ferrite phase, which has a body-centered cubic (BCC) crystal structure. As the carbon content increases, a new phase called cementite, with an orthorhombic crystal structure, begins to form. This phase is extremely hard and brittle.
But what about the most well-known phase of steel—martensite? Martensite is a metastable phase that forms when austenite, a high-temperature phase with a face-centered cubic (FCC) crystal structure, is rapidly cooled. This transformation, known as martensitic transformation, imparts exceptional hardness and strength to the steel. It is this transformation that takes place during quenching, a critical step in heat treatment processes.
The Iron Carbon Phase Diagram also reveals the existence of other phases, such as pearlite, which forms when austenite is slowly cooled. Pearlite is a lamellar microstructure consisting of alternating layers of ferrite and cementite. Its presence can significantly affect the mechanical properties of steel, such as strength and toughness.
Understanding the Iron Carbon Phase Diagram empowers engineers and materials scientists to tailor the composition and heat treatment of steel to achieve desired properties. By carefully selecting the carbon content and controlling the cooling rate, it becomes possible to manipulate the microstructure and, consequently, the mechanical characteristics of the final product.
Moreover, the phase diagram serves as a crucial guide in alloy design. By introducing alloying elements like chromium, nickel, and molybdenum, the diagram can be modified, allowing for the creation of stainless steels, tool steels, and other specialized alloys with unique properties.
In conclusion, the Iron Carbon Phase Diagram is a treasure trove of information for anyone working with steel. It unravels the complex relationships between composition, heat treatment, and resulting microstructure, unlocking the secrets to achieving desired properties. By harnessing the knowledge embedded in this diagram, engineers and materials scientists can continue to push the boundaries of steel innovation, creating stronger, more durable, and more versatile materials that shape the world around us.
Download our Iron Carbon Phase Diagram resource and contact our Kormax Metallurgy team to discuss your project’s specific alloy specifications.